Gomotion made our data visualization look premium overnight and saved hours each week.
Gomotion helps saas companies produce stunning data visualization customized for LinkedIn Ads, without expensive agencies or motion design experience.
Lock logos, fonts, and colors so every data visualization stays consistent for saas companies.
Produce polished data visualization in under 5 minutes—perfect for rapid LinkedIn Ads iterations.
Cut production spend with AI templates and reusable scenes built for saas companies.
Auto-size and export to platform‑perfect specs for LinkedIn Ads—no manual edits.
Batch-generate variations to test hooks, CTAs, and styles for higher engagement.
Comment, version, and approve in one place—no file ping‑pong.
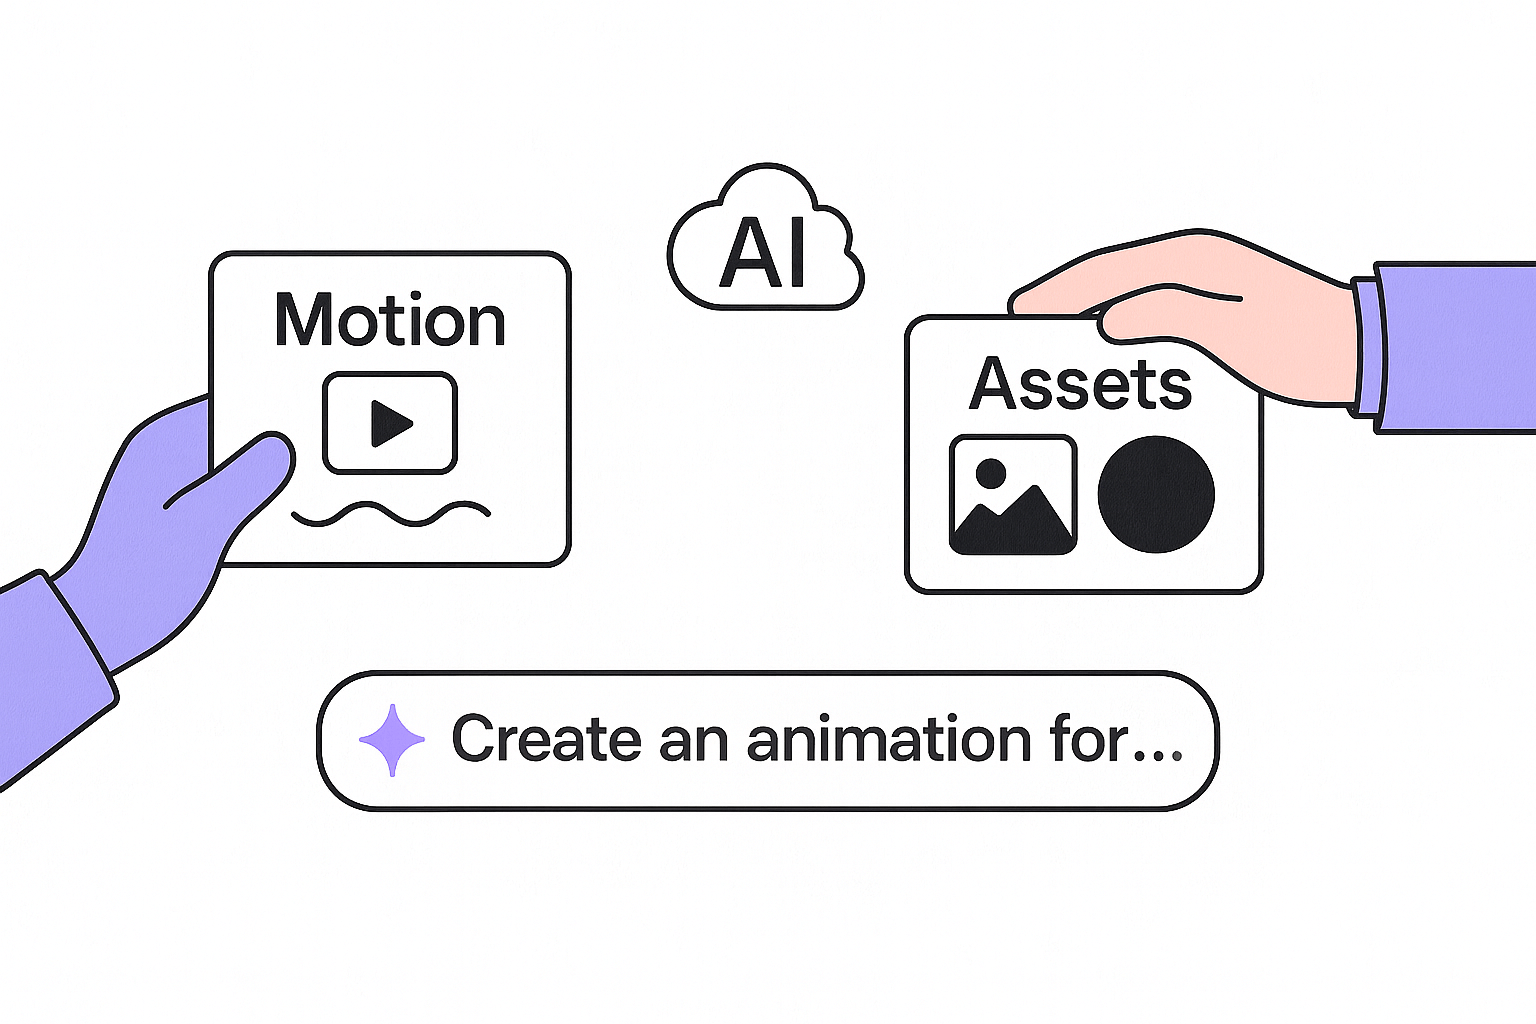
From concept to data visualization in three steps—optimized for your brand and channels. Outline your goal, audience, and message; then pick styles that match your brand. Export in the right aspect ratio for each channel and plan simple A/B tests to keep improving.
Import CSV or connect sources to visualize KPIs and trends. Focus on capturing the core message, audience, tone, and motion style. Clear prompts lead to better concepts and fewer revisions.
Pick chart types and transitions that highlight insights without clutter. Ensure brand consistency with fonts, colors, and safe areas. Optimize pacing and composition so animations feel native to each platform.
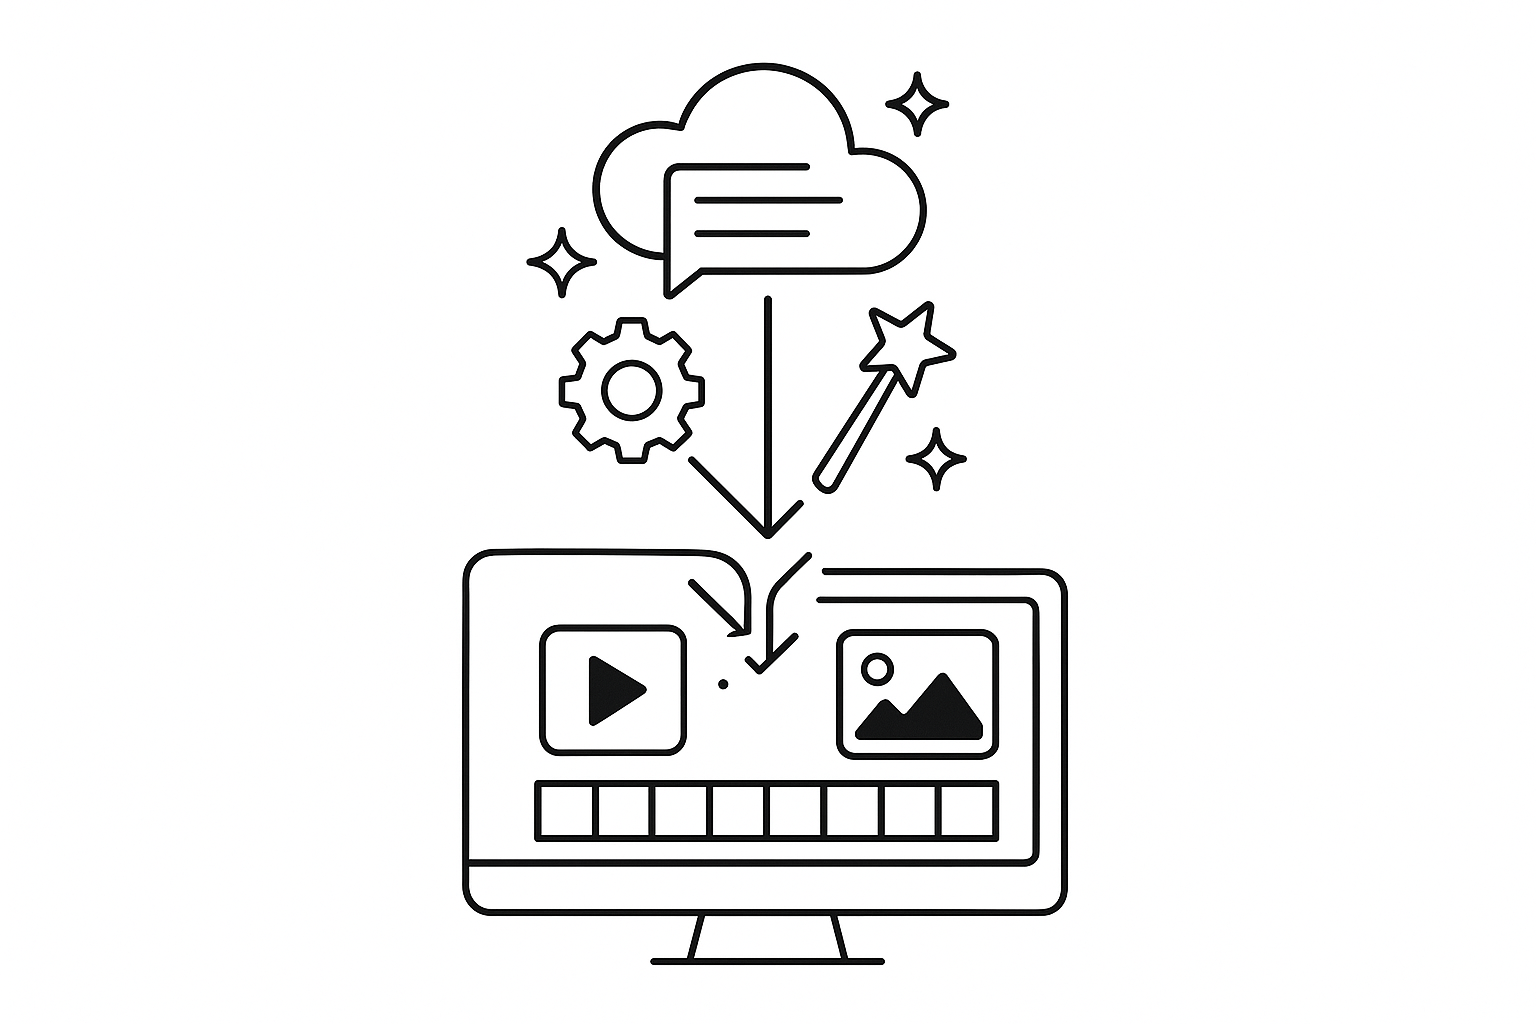
Export video or GIF and embed in slides, docs, or social posts. Export in the correct formats, then monitor engagement metrics like thumb-stop rate, completion, and CTR to refine future variants.

Extend your workflow with templates, brand kits, and narrative tools.
Turn scripts into multi‑scene videos with synced visuals and VO.
Apply your colors, fonts, and logo automatically for consistency.
Animate charts and stats for clear stories and explainers.
Explore product‑focused scenarios tailored to your needs.
Practical data visualization that fit your day‑to‑day workflow.
Launch assets faster with reusable scenes and styles.
Channel‑native outputs ready for distribution.
Share, comment, and scale production without bottlenecks.
Everything you need to know about Gomotion for saas companies.